Regression to the mean and illusory correlation - Instructor notes
Praise and punishment
What is it?
Interactive demonstration of regression to the mean.
Interactive activity
Web-based shove-hapenny where a penny moves along the screen and ends up in one of a number of scored regions (0 pts, 10pts, 20pts, 100pts, 20pt, 10pts, 0pts - the 100pt region is quite small). The player is told that how long they hold the key down for affects how far the penny goes. This is not true, the distance the penny travels is sampled from a random normal distribution.
Students play in pairs. One shoves pennies. The other says ‘well done!’ enthusiastically each time they land on the 100pts. They then record whether the person does better or worse next time. They do this 30 times. The one giving praise also keeps a tally of what happens after each praise - do they do as well next time, or worse? At the end, they work out which of those two things was more frequent and note this down for later.
They then swap over, the other person shoving the penny. But the feedback this time is to say ‘YOU SUCK - TRY HARDER!’ each time they score 0pts. And note down whether they do better or worse next time. Do this 30 times. Again, at the end, they work out which of those two things was more frequent and note this down for later.
Once both parts of the activity are complete, one member of the pair enters their two results into Mentimeter.
Post-activity mini-tutorial
Class leader reveals the results of the Mentimeter poll. You will find they do better after punishment. The effect of praise will be that on average performance will be worse.
Discuss what we can conclude from this.
The class leader then reveals that the game was entirely random, the outcome being drawn from a random normal distribution. How does this affect their conclusions? Why does it happen?
The class leader uses the normal distribution to illustrate that poor performance was a rare event. Most events have a higher score, so it’s likely by chance that the next score will be higher. Opposite pattern for the very high performance.
Label this phenomenon as ‘regression to the mean’. Talk about some examples where it might apply in real life (e.g. ‘special measures’ in OFSTED inspections) and in experiments (e.g. David Shanks’s implicit experiments).
The graphs in these slides were created using R. The source code is available in the github repository. The relevant files are:
reg-to-mean.R
shovehapenny.csv
Good and evil (Illusory correlation)
What is it?
Interactive demonstration of illusory correlation
Note: These materials are a placeholder; the exercise is being somewhat updated for 2022. Any queries, ask Lenard Dome.
What do they do?
Students work individually. Each student views a series of positive and negative statements about members of two groups, displayed by the class leader. The slides are available here.
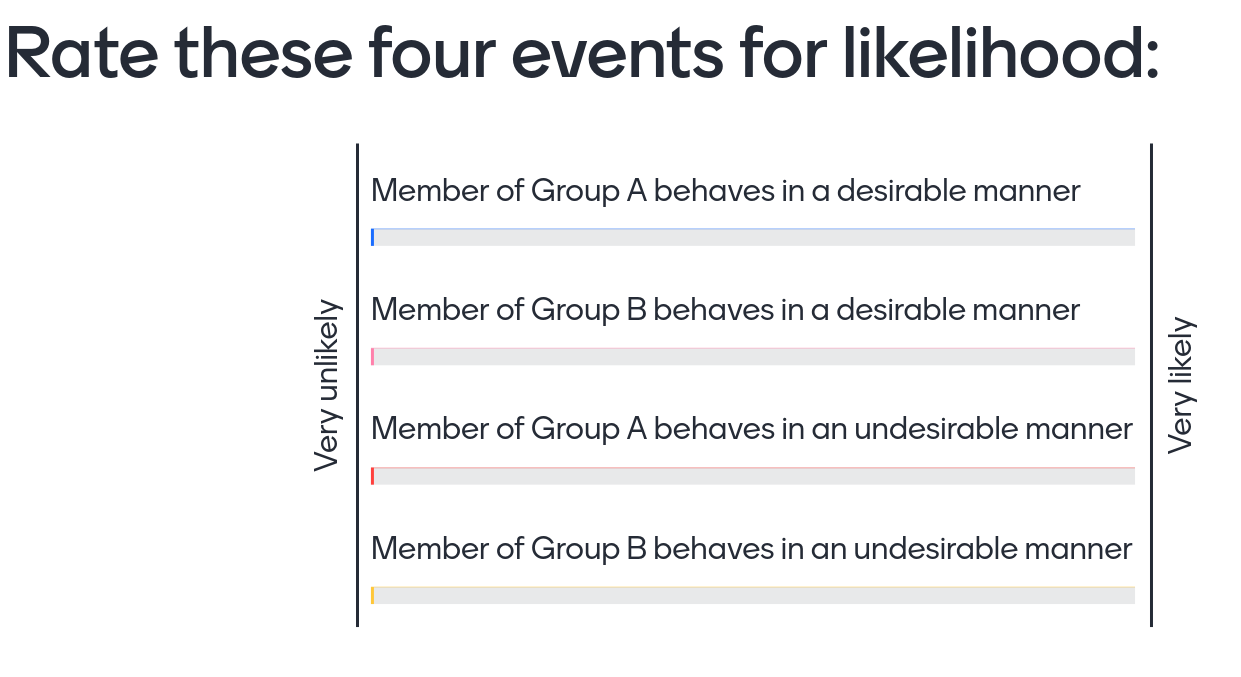
The students then rate the likelihood that members of the two groups engage in desirable and undesirable behaviours, using a mentimeter poll - example format. The results of the poll are not shown to students until all have completed.
Post-activity mini-lecture
Class leader reveals results of the study. The calculation you’ll need to do here is as follows:
-
Work out the goodness score for Group A (desirable - undesirable). e.g. 6.8 - 2.1 = 4.7
-
Work out the goodness score for Group B e.g. 6.5 - 2.5 = 4.0
The extent to which one group is favoured over the other is the extent to which these two scores differ.
The expected result is that Group B (which is smaller), will be seen as less good.
Leader then reveals the table of desirable/undesirable behaviours versus group membership, and points out the desirable/undesirable ratio is the same for the two groups, but that one group is smaller. Makes some connections to e.g. real-world prejudice but mainly emphasises the ubiquity of the effect and the importance of producing these kind of contingency tables and looking at ratios (This will set up chi-square-like comparisons for future modules).
Source materials
The web-based activity was created using the RPres format support by RStudio. The relevant files, which you can find in the github repository, are:
irr-corr.csv
irr-corr.Rpres